

ALYAWMGOLD OPEN DATA · VERSION 1.0.0
Gold & silver.
681 months of history.
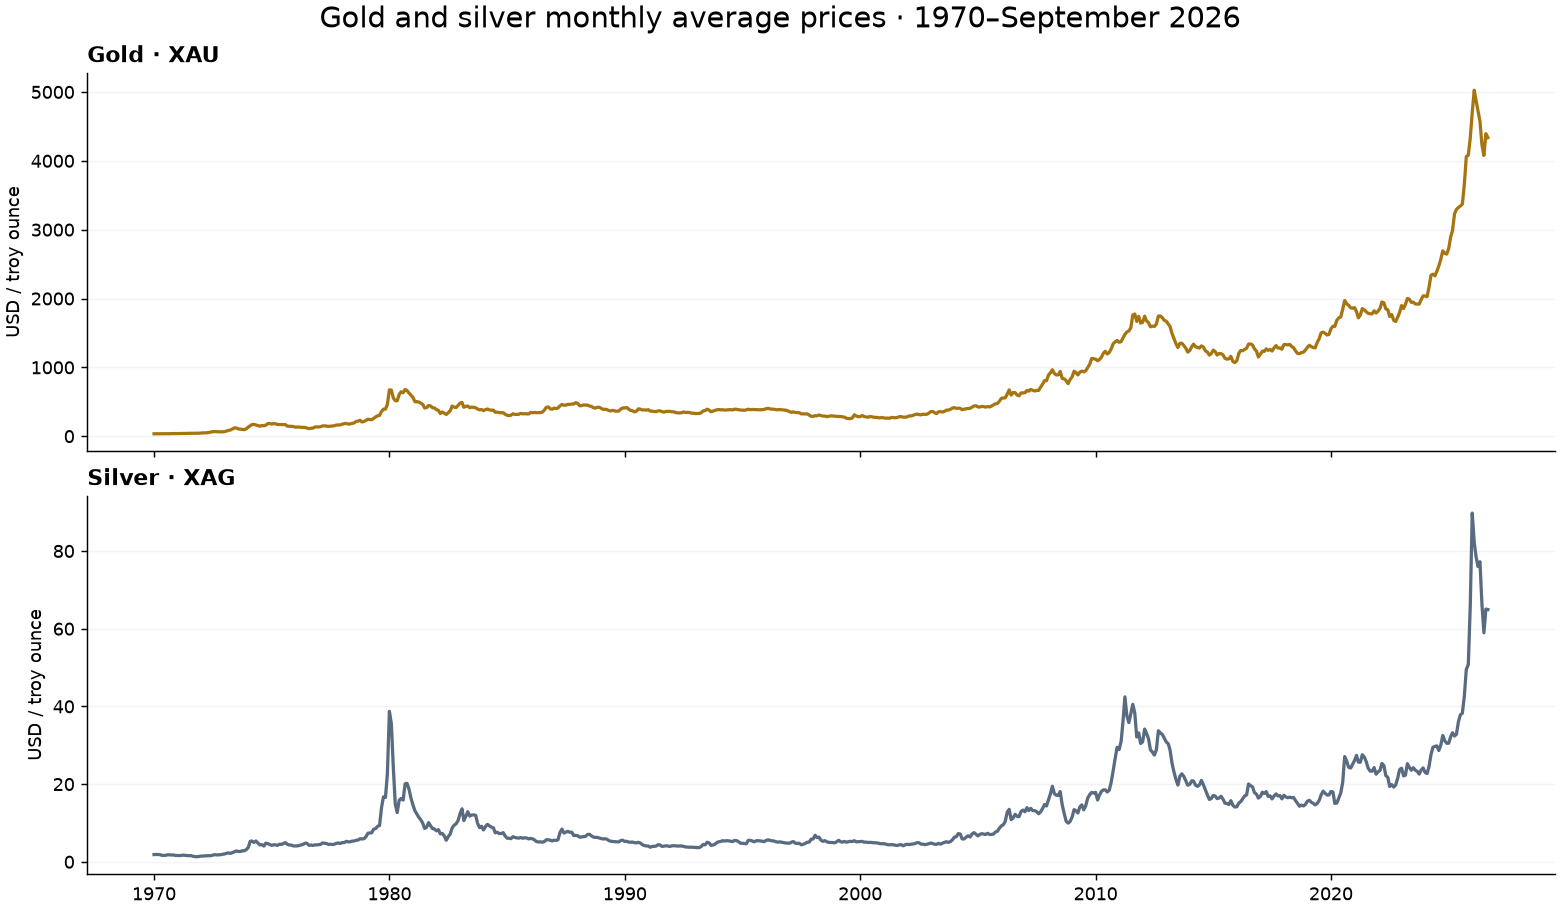
Explore monthly gold and silver price averages from January 1970 to September 2026. One simple JSON file, ready for your next chart, analysis, or research project.
About 95 KB · No account required · CC BY 4.0
- Coverage
- 1970–2026
- Frequency
- Monthly
- Currency & unit
- USD / troy oz
- Metals
- Gold + silver
THE LONG VIEW
Two metals. More than five decades.
A SIMPLE FORMAT
What’s in the download?
The JSON includes release metadata, source URLs, retrieval timestamps, quality notes, and a data array with 681 consecutive monthly records.
| Field | Meaning |
|---|---|
month | Calendar month, YYYY-MM (UTC) |
gold_average_usd_per_ounce | Gold (XAU) monthly average |
silver_average_usd_per_ounce | Silver (XAG) monthly average |
Both price fields are numbers in nominal USD per troy ounce. Only completed months are included; October 2026 is excluded from this release.
YOUR FIRST RECORD
Easy to read. Easy to use.
Each entry in data follows this structure:
{
  "month": "1970-01",
  "gold_average_usd_per_ounce": 35.193184,
  "silver_average_usd_per_ounce": 1.857077
}
Load the full file in Python:
import json
import pandas as pd

with open("monthly-gold-silver.json") as f:
    dataset = json.load(f)

df = pd.DataFrame(dataset["data"])
df["month"] = pd.to_datetime(df["month"])
CHOOSE YOUR WORKSPACE
Find the dataset where you work.
SOURCES & METHODS
Where the numbers come from.
Gold API is the primary source of the historical gold and silver price data. AlyawmGold prepares, organizes, and publishes this monthly dataset. Source URLs and retrieval timestamps are recorded in the JSON.
These are source-reported monthly averages, preserved without interpolation or currency conversion. The snapshot was collected on October 28, 2026. It is a versioned release; it does not update automatically.
READ BEFORE ANALYZING
Know the limits.
Monthly averages are different from month-end closing prices, live quotes, and retail dealer prices. Values are not adjusted for inflation. Decimal precision does not establish accuracy.
Reference screening against World Bank data found differences above 5% for gold in December 1980 and July 1983, and silver in December 2025. These remain unresolved comparisons, not confirmed errors; source values are retained.
Source reconciliation does not independently verify the entire upstream history or a uniform averaging method. A ratio of monthly averages is different from an average daily ratio; changes in monthly averages are not investment returns.
OPEN DATA, WITH CREDIT
Use it. Credit the source.
Published under Creative Commons Attribution 4.0 International, to the extent of rights held by the licensor. Credit AlyawmGold, retain source acknowledgments, link the license, and indicate changes. No additional rights in third-party material are granted.
AlyawmGold. (2026). Monthly Gold and Silver Prices (Version 1.0.0) [Data set]. Zenodo. doi:10.5281/zenodo.23738959